Friday, September 28, 2012

Spring and Summer Electricity Bills with Solar Power

From my last post, I indicated that one of my recent electricity bills was really low ($16), but I didn't delve into the bill details.  What I'd like to do in this post is share a bit about those bill details and the elements that comprise a typical electricity rate plan for solar power owners here in Texas.

On that note, I logged into my account online and took a screenshot of the "current electricity details" portion of my March 2012 bill (my rep is Reliant, could this information may be called something similar with TXU or Green Mountain statements).

The first thing to notice is the "29 day billing period". Why is this not simply the first day of the month to the last day of the month?  Most likely because my old analog electricity meter required someone to physically come and read the meter values for billing purposes.  My premise (home) was probably lumped together with other homes in my area into a "billing cycle", while taking into account weekends and holidays, and given the dates of 3/6/2012 to 4/4/2012 so that the meter reader could more conveniently read as many meters as possible.

Of course, with the new smart meters, I'm guessing it's really not necessary to have the billing cycle fall on these predetermined dates since a meter reader person is no longer necessary.  However, it's probably more of a legacy billing system and business process holdover for utilities to do it this way.

In the future, as utilities' IT systems mature, I'd hope that they would allow customers to choose the dates for each month's billing cycle since one of the advantages of smart meters is the granularity of the data (15 minutes, so daily sums are easily possible).

At left are more screenshots, including portions of my April and May electricity bills.

Again, notice the billing days each time.  My April bill shows 4/4/2012 to 5/4/2012, while my May bill shows 5/4/2012 to 6/5/2012.  Interestingly, the date of 5/4/2012 shows up in both statements, so which one is correct?

What is missing here are the times on those dates for which meter readings are included.  My best guess is that "start date" is inclusive of all hours on that day, while the "end date" is exclusive of that day's hours (meaning midnight).  In other words, my April bill would go from 12:00am on 4/4/2012 to 12:00am on 5/4/2012.  What do you think?

At right are a few more screenshots, this time from my Summer electricity bills.

The next line items to notice are the Energy Charge (which I explained briefly here) and the Grid Credit (which is touched on here).

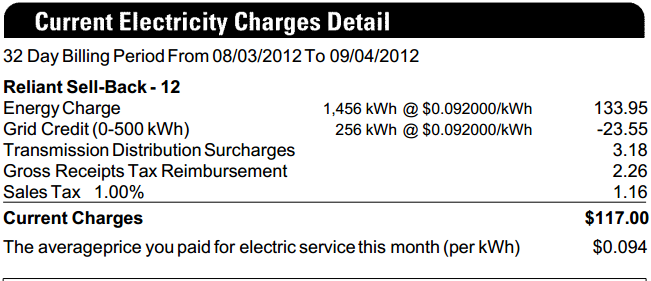
My rate is the same in each bill (meaning it's a fixed rate) and the usage was steadily increasing from March through May (551 kWh to 946 kWh consumed).  This indicates that it was getting warmer and my A/C was in use a bit more each month.  Since we us natural gas in my home for heating, I expect this trend to reverse once the Fall months come around.

Also, notice that the rate for Grid Credit was the same as the Energy Charge ($0.092 per kWh).  This is the great thing about have a rate plan that pays me back for excess solar power placed back onto the grid.

Interestingly, since I know that my solar panel system produces at least 800 kWh in the Spring/Summer months, I can simply subtract the Grid Credit kWh number from the amount of energy I produced in that month to figure out how much of my solar production I consumed that same month.

So it's apparent that I'm saving some money each month with solar power, but what's the difference compared to last year?  Glad that I asked!

At left is one final screenshot, from my August bill, of the "electricity usage summary" section.

The difference between August 2011 and August 2012 was about 1400 kWh, about 50% less.  Since solar power provided about 600 kWh of my total consumption, my bill without solar would have showed about 2000 kWh sans solar power.  Then, where's the 800 kWh difference coming from?

One potential culprit is the Billing Days line item.  However, last year my August billing cycle had fewer days than the same period this year, so that should have led to a smaller difference.

Another factor could have been that we were more diligent in watching our electricity use, such as turning off various electronics when not in use and turning up the thermostats another degree (while using ceiling fans instead).  This would probably have a measurable effect on energy savings, although it would take some effort to determine the exact amount (time to finally plug in my home energy monitor!).

One last factor to consider is the average high temperature in the billing period.  Last year in August, Texas had it's worst heat wave ever, with average highs measured at 104 degrees F.  However, this year has been much tamer, with average highs around 97 degrees F.  I believe this is the primary reason for the 800 kWh difference between August last year and this year.

Anyways, I hope this provided some useful insights into the billing aspects that a solar energy home owner sees these days.  Please feel free to post any questions and I'll try to get back to you sooner than my recent post history would indicate...

Wednesday, June 20, 2012

Energy Sell-Back (or Buy-Back) Electricity Rate Plans

My fault, it's been a while... my goal when I created this blog was to have at least 1 "useful" post per month.  Although I have a lot of ideas, simply putting "pen to paper" has been much harder than I had expected.

Anyways, the topic of discussion this time is related to a previous post around my new solar panels.  As I described in that post, I was (and still am) really excited with the new system and the benefits that came with having had it installed.

I also alluded to the efforts to try and find the right electricity rate plan.  Initially, I struggled with how pick the right provider.  Prior to that, I touched on how to choose an electricity rate plan, but that was with the mindset where, like most homeowners, I would only be consuming electricity.

However, I needed to shop for a rate plan while also taking into consideration that I could generate excess electricity and put it back on to the grid.  This made comparing rate plans a bit more challenging.

On that note, a few things I needed to keep in mind while shopping for the right rate plan for a solar powered home:
1) Does the retailer offer a plan that actually purchases "net outflow"? (excess electricity generated that is placed back onto the grid)
2) What's the rate of "buy back"? ($ per kWh rate that the retailer will purchase net outflow)
3) How does this cost compare to non-buy back rate plans?

Example of retailer that doesn't buy back power.
About #1, the easiest way is to look at any of the retailer's rate plans and under the "Disclosure Chart" section (included with all Texas deregulated Energy Facts Labels).  There you will see a line item about whether or not they purchase excess renewable generation or net outflow.

Example of retailer that buys back power.
After determining whether or not a retailer purchases excess renewable generation, the search is then narrowed down to the specific rate plan(s) from the retailer that specifically allows for bill credits resulting from net outflows.

My search led me to just three in Texas that offer a buy-back rate plan:
- Reliant Energy
- TXU Energy
- Green Mountain Energy

With that, the next question, from #2 above, is about each retailer's policy on purchasing excess generation.

Not surprisingly, I discovered that this policy varies by retailer:
- Reliant's policy provides "a credit at the full retail energy charge for the first 500 kWh returned to the grid each month" and above that "5 cents per kWh credit for additional generation above 500 kWh that is returned to the grid"
- TXU's policy "will pay you 7.5¢ / kWh for surplus generation from solar units" (and from what I understood, there was not a kWh cap)
- Green Mountain's policy will pay for "the first 500 kWh per month of surplus power, the credit will be the same per kWh rate that Green Mountain charges for the Renewable Rewards electricity product" and above that "the buy-back rate will be reduced by 50 percent"

I threw those variables into a spreadsheet and, with some seasonal kWh assumptions, I determined that below 10 cents/kWh Reliant's plan was the best, with Green Mountain coming in second.  However, both retailer's rate plans have energy charges that are a bit higher than their own "run-of-the-mill" rate plans (at least 10 to 20% higher).

About TXU Energy, they offer buy-back on any rate plan, which is really nice, with the only requirement that you fill out a surplus generation agreement.  I would consider one of their plans if my net outflows were more than 500 kWh of electricity each month.

In a later post, I'll try to share some of the detailed analysis around the calculations leading to those conclusions.

Lastly, about question #3 above, I started my research with the assumption that buy-back rate plans could be compared with non-buy back plans.  However, after having had a new smart meter installed (required where I live in the Texas ERCOT market) with my solar panel system, I found that comparison is truly an apples-to-oranges scenario.

A little background before I get into "why":
  • The old electric meter was analog
    • Meaning it had a physical set of dials that showed how much electricity was flowing across the meter (for most people it flowed in one direction since electricity in the house was only being consumed)
    • The limitation to this technology was that it had to be physically visited by someone, typically once per month, for purposes like reading (billing) or disconnection
  • The new electric meter, or smart meter, is digital
    • Meaning it encompasses several technologies, such as wireless communication, that eliminate the need to be visited by someone for measurement or disconnection
    • Another advantage is the ability to read the flow of electricity more frequently, like every 15 minutes, which allows further insight into daily household energy use
So, why is the difference between old and new meters important?

If I had an analog meter with my solar panel system, those dials measuring my electricity flow would spin forward when I was using electricity and backward when I had excess generation going back onto the grid.  This would essentially credit me for all of my net outflow.  I actually was in this situation for a few weeks after my solar panels were installed while waiting for the smart meter to be put into place.

With the new smart meter (specifically the one designed for solar panel owners), it has two channels of measurement.  One for inflows (power taken from the grid and into my home) and the second for outflows (power placed onto the grid that I didn't consume).  So, essentially nothing "spins" backward.  The numbers measuring kWh only go forward.

This is important because retailers will see both numbers (inflow and outflow readings), but it's up to them whether or not they care about the outflow.  For most retailers, they would only bill on the inflow reading and never credit you (nor would they be obligated to) for the outflow reading.

Bottom-line, it really goes back to question #1 and focusing on retailers that offer a buy-back plan.  Comparing them with other retailers who only take into account electricity usage and exclude potential credit for excess generation doesn't make much sense, especially if I'm trying to maximize my investment in solar power.

Given that, I'll share with you a number from one of my recent monthly bills:  $16

Not bad, right??

(yeah yeah, "wait 'til summer" you say...)

Thursday, April 26, 2012

We got Solar Power for our home! But, what's the ROI payback?

View of our solar panels from the alley
Yes, that's right.  Solar panels, on our roof, just in time for summer!

I'm really excited about the benefits (primarily to save money), but our setup was only made possible, financially, due to:
1) Federal tax credit of 30% with no cap
2) Local utility rebate of $2 per Watt up to $20,000
3) Solar lease option (such as with SolarCity)

Photovoltaic (PV) systems are so much more affordable than they were not even 5 years ago, due to the federal tax credit (which has been extended through 2016) combined with other available rebates, like my incentive from Oncor.  Additionally, component costs have been dropping quickly the last few years as well, further improving bottom-line cost of a residential PV system (although potentially making rebate/incentive programs unnecessary).

Regarding the third item from the list above, there were two options when deciding how to fund (out of our pockets) the solar equipment and installation:  Buy it or lease it.

Just like buying a car, purchasing the PV system means that we pay the entire upfront cost of equipment and installation, plus all ongoing maintenance and insurance for the life of the system.  However, we get to enjoy use of the system for its operational lifespan (at least 30 years) and include it in the price of the home, if we sell sooner.

On the other hand, leasing a PV system simply requires that we pay for the use of the equipment for a predefined number of years.  Since the lease company owns the equipment, ongoing maintenance and insurance is handled by them as well.  In our setup, our lease is for 15 years, so we will not enjoy its use through its full operational lifespan.  The primary benefit is the lower upfront cost of the system.

View of our solar panels from the street
For example, a recent quote that I received (in 2011) to buy a 6.2 kW system where I live (in the Dallas-area) had a total cost of about $40k, before all incentives were included.  With incentives (both federal and local), the total cost had dropped to about $19k.

Compared to the PV system that we actually leased, at 6.4 kW, our full prepaid cost was about $5k.  The lease company can offer this lower cost because they receive the federal and local rebates, instead of us.  Also, my guess is that they factor in the potential value of the equipment at lease-end.

So, what's the payback to break even (and enjoy free electricity)?

Both systems are estimated to generate around 8,600 kWh per year, which an average of a little more than 700 kWh per month.  Electricity prices fluctuate greatly from year-to-year and the actual savings is a bit more complicated than most PV-pushers (go figure) will tell you, but using a buy-back (I'll explain this in a future post) rate of about $0.075 per kWh, that's a savings of about $50 per month.

Now, taking the upfront costs and the monthly savings together, we get...
Purchase: $19k/$50 per month = 380 months (31 years)
Lease: $5k/$50 per month = 100 months (8 years)

It's now fairly obvious that the lease option was much more attractive than buying the system outright.  We can enjoy free electricity generated from our solar panels in years 8 through 15.

Despite federal and local rebates, which cut the total cost by more than half, purchasing a PV system is still not a financially viable option, which I presume is the case for most homes, assuming your local utility rebate terms are similar.

I'll post more goodies about how we went about shopping for an electricity rate, considering our newly installed solar panels.  You may be surprised to know that most electric retailers don't pay (also known as buy-back or net metering) for excess energy put back onto the grid.  Details coming soon.

Thursday, March 29, 2012

Compare Electricity - Index Rate Plans

So I've FINALLY picked a new electricity plan after my last fixed rate contract expired several months ago... After shopping around for a little while, I decided to go with an indexed rate offer from Reliant, called the "Reliant PowerTracker".

Similar to variable rate plans, index rates can vary from month-to-month.  This sounds scary upon first glance, however, index rate plans provide more insight into the price that you'll actually pay each month.

Whereas variable rate contract language may state, "After the initial rate, your next bill's rate is up to sole discretion of Retail Provider X", an index rate is one in which the price you pay for energy is tied directly to the price of some energy market index, in this case the last settled price of the NYMEX Natural Gas Futures Contract.  This allows you to receive a "heads-up" on the direction in which your final cost of electricity is going.

In order to get to that final cost, we have to add one more pricing component to the ones that I've covered previously:  An Indexed Energy Charge.

This charge is calculated using a predefined Gas Multiplier (as outlined in the rate offer):

Notice that in the screenshot above from the Reliant PowerTracker product, the Gas Multiplier is defined at four different times of the year.  Why is this the case?  I'm not certain, but from what I can tell, the multiplier is basically higher during the hottest months of the year (June-September).

The only other retailer besides Reliant to offer another indexed rate plan is TXU, called the "TXU Energy MarketEdge".  Their Index Energy Charge is calculated in the same manner, but using just two different Gas Factors (or Multipliers), again depending on the time of year:

Taking into account this index energy charge, the calculation is simply a matter of including that with the base charge, kWh energy charges, TDSP charges and monthly kWh usage to get to your final bill.  Here's the Reliant screenshot outlining the calculation:


On a related note, TXU Energy's recent "No Vari-a-Bull" rate marketing is interesting because it appears as though they are trying to distance themselves from variable rate plans in general, even though their "MarketEdge" product, being an indexed plan, is basically variable as well (changes from month-to-month).

However, to their credit (being an indexed plan), since each month's price is clearly explained (as shown in the screenshots above), their most variable product will not suffer the surprise expiration of a typical variable rate's initial promotional teaser price as exists with other retailers.


Anyways, with summer approaching soon, I'm pretty close to switching to a fixed rate again (yes, after just a few months with the indexed plan), but with natural gas prices near 10-year lows, perhaps it's now best to lock in a rate.

Monday, March 5, 2012

Electric Space Heaters - Are They Cost Effective?

As winter ends and spring approaches, I wanted to write a quick note about electric space heaters.  In particular, I want to review the costs behind running a few of the ones that we have in our home.

During last year's Thanksgiving holiday weekend, Lowe's had a deal ($50) for this electric "stove" space heater (complete with fake flickering flame!).  We already had these oil-filled radiator electric space heaters in the kids' bedrooms (bought 2 for about $60 each) and I was just looking for something for the master bedroom.

Our home is heated mainly from a central gas unit (we set our thermostats at 74 degrees), however I use the oil-filled heaters to set a more even and consistent temperature in the bedrooms, but only at night and typically when outside temperatures dipped into the 50's and below.

The Honeywell oil-filled units were especially nice due to the digital temperature controls and LCD display of the current ambient room temperature.

The Duraflame heater basically acts (and sounds) like a hair dryer, just blowing air over a heated coil, albeit more quietly.

The main difference between the two heater types, that I've noticed, is that the air doesn't stay as consistently warm with a "blower" based electric heater, as opposed to an oil-based radiator which seems to retain (and thus radiate) heat throughout the air space more effectively.

Anyways, back to the point of this post... I used the Kill-a-Watt energy measurement device to figure out how much energy these heaters used, on the same night (outside temperatures were in the 50's).

I set the Honeywell oil-filled heater to "level 1" (lowest power setting) at 75 degrees and the Duraflame air heater to about halfway (unfortunately, there is no temperature or power settings, just on/off and a power dial).

Over a 12 hour period, the oil-filled radiator consumed about 0.8 kWh per hour, so over the course of 12 hours at 10 cents/kWh, that added up to about $1 for the night.

The air heater consumed about 0.4 kWh per hour, which added up to about $0.50 for the night, using the same time period and price/kWh.

I probably could have turned up the air heater a bit more (than halfway) to make the room feel as comfortable as the oil-filled radiator did, which would most likely have caused the air heater's electricity consumption to go up.  It's rated at 1350 watts, so if I were to run it the whole night at that top setting, it would cost about $1.62, although running it at the max sounds like overkill.

On that note, I've got 2 oil-filled heaters, and running them over the month of January cost us about $60.  Adding the air-heater (about $15), brings the total for electric space heating in my home to about $75.

Central gas heating cost us about $110, which is not too bad in a typical Dallas-area January, but considering how mild it has been this season, I wonder if this could have been better.  Note that this cost is also for all-day heating, not just at night.

What I would love to do (contingent upon the wife's blessing) is to turn off the central gas each night for a month and use only space heaters in the bedrooms.  Then, in another month use only central gas each night and compare the two costs.

Making comparison a bit more difficult, however, is finding the right months that will have very similar weather and follow the same daytime energy usage (TV, lights, laundry, etc.) patterns in both months, so not to skew the results.

Now that it's already March, I'll simply shelve this for some time and revisit this experiment in the late fall this year... try and remind me if you're interested.